Immersive Storytelling – Photogrammetry & Augmented Reality

Brown Institute at Columbia 2950 Broadway, New York, NY, United States

From augmented, mixed and virtual reality, to 3D storytelling, immersive technologies provide new opportunities for journalists to broaden their stories and engage readers. While these technologies have been deployed in museum spaces, game design, and architecture/planning, journalism has been slow to move beyond 360-degree video and basic implementations of augmented reality. When outlets such as


Statistics Breakfast with Mark Hansen (Thursdays in February and March 2021)

Virtual

Some of the biggest stories of 2020 were statistical. We tracked exponential curves as COVID-19 spread across the country. On the 50th anniversary of Earth Day, we reassessed the pace of climate change. And after the 2020 Election, the country debated whether any of the then-President’s claims about voter fraud could be true, attempting to

Statistics Breakfast with Mark Hansen (Thursdays in February and March 2021)

Virtual

Some of the biggest stories of 2020 were statistical. We tracked exponential curves as COVID-19 spread across the country. On the 50th anniversary of Earth Day, we reassessed the pace of climate change. And after the 2020 Election, the country debated whether any of the then-President’s claims about voter fraud could be true, attempting to

Volumetric capture and immersive technologies – primer

Virtual

What are the differences between AR, VR, and MR? What are some options out there for creating and publishing immersive content? In this session, we'll map the current landscape of immersive and volumetric technologies and clarify essential terminology. About the series The Brown Institute is pleased to announce the launch of Volumetric Reporting, supported by

Columbia Hacking for Humanity

Columbia University

Hacking for Humanity is an opportunity to initiate and get traction for startup ideas that are focused on solving a problem for people and/or the planet. There are many terms used to describe such ventures including: “impact ventures”, “double bottom line”, “double impact”, “triple bottom line”, “sustainable”, “ESG”, and others. We use the term social

Pitch Practice Workshop for the Innovation Challenge in Journalism, Media, and Technology

Zoom Meeting

Register Here The application deadline for this Challenge is coming up. This pitch practice workshop, tailored for first-time founders, will also help you draft your best application. Join us for this informal and interactive workshop designed to help you present with confidence and credibility. This workshop is specifically designed for folks who may not be

Exploring and Mapping NYC’s Building Energy Data Through Programming

Virtual

This event is part of NYC Open Data Week 2022. We've all seen the energy grades posted at the entrances of large buildings in New York City. But how does one building compare to its neighbor, or to buildings in other parts of the city? And how is the city doing overall? Are grades improving

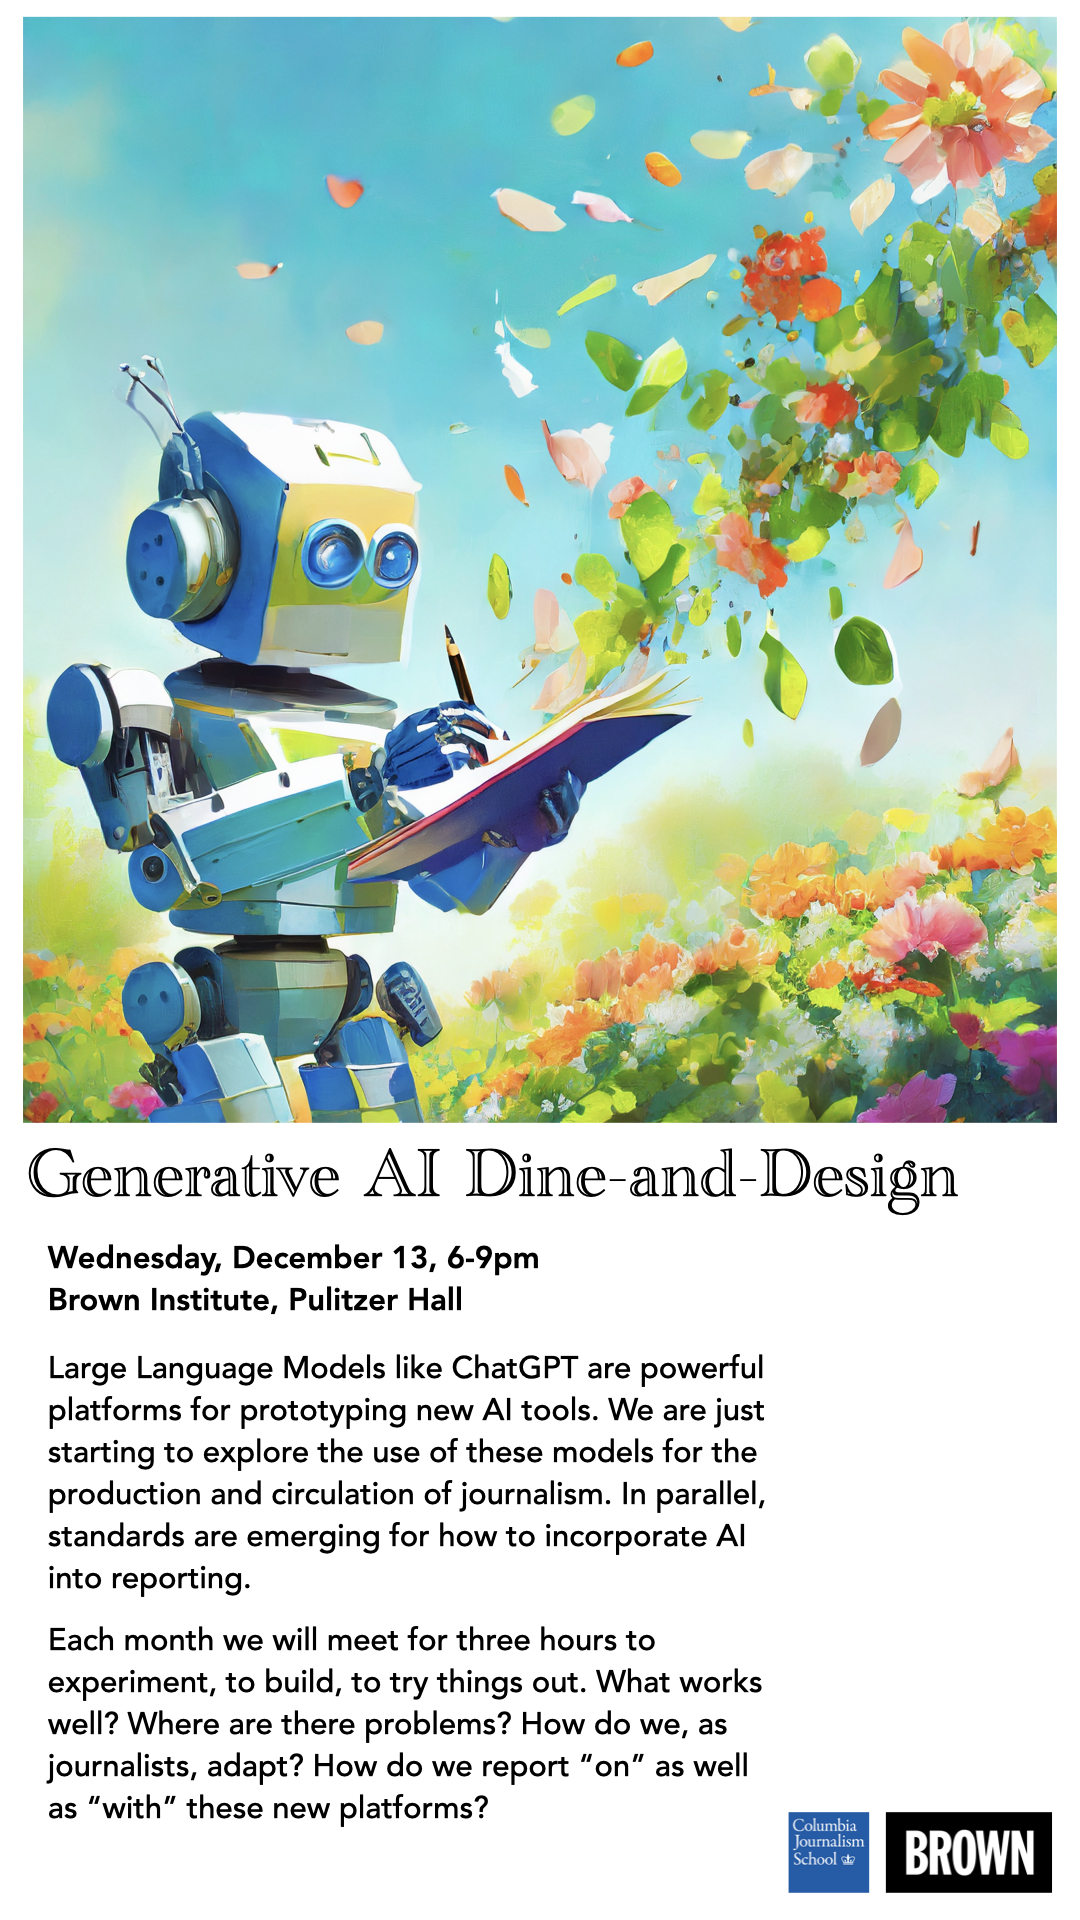
Generative AI Dine + Design

Brown Institute at Columbia 2950 Broadway, New York, NY, United States

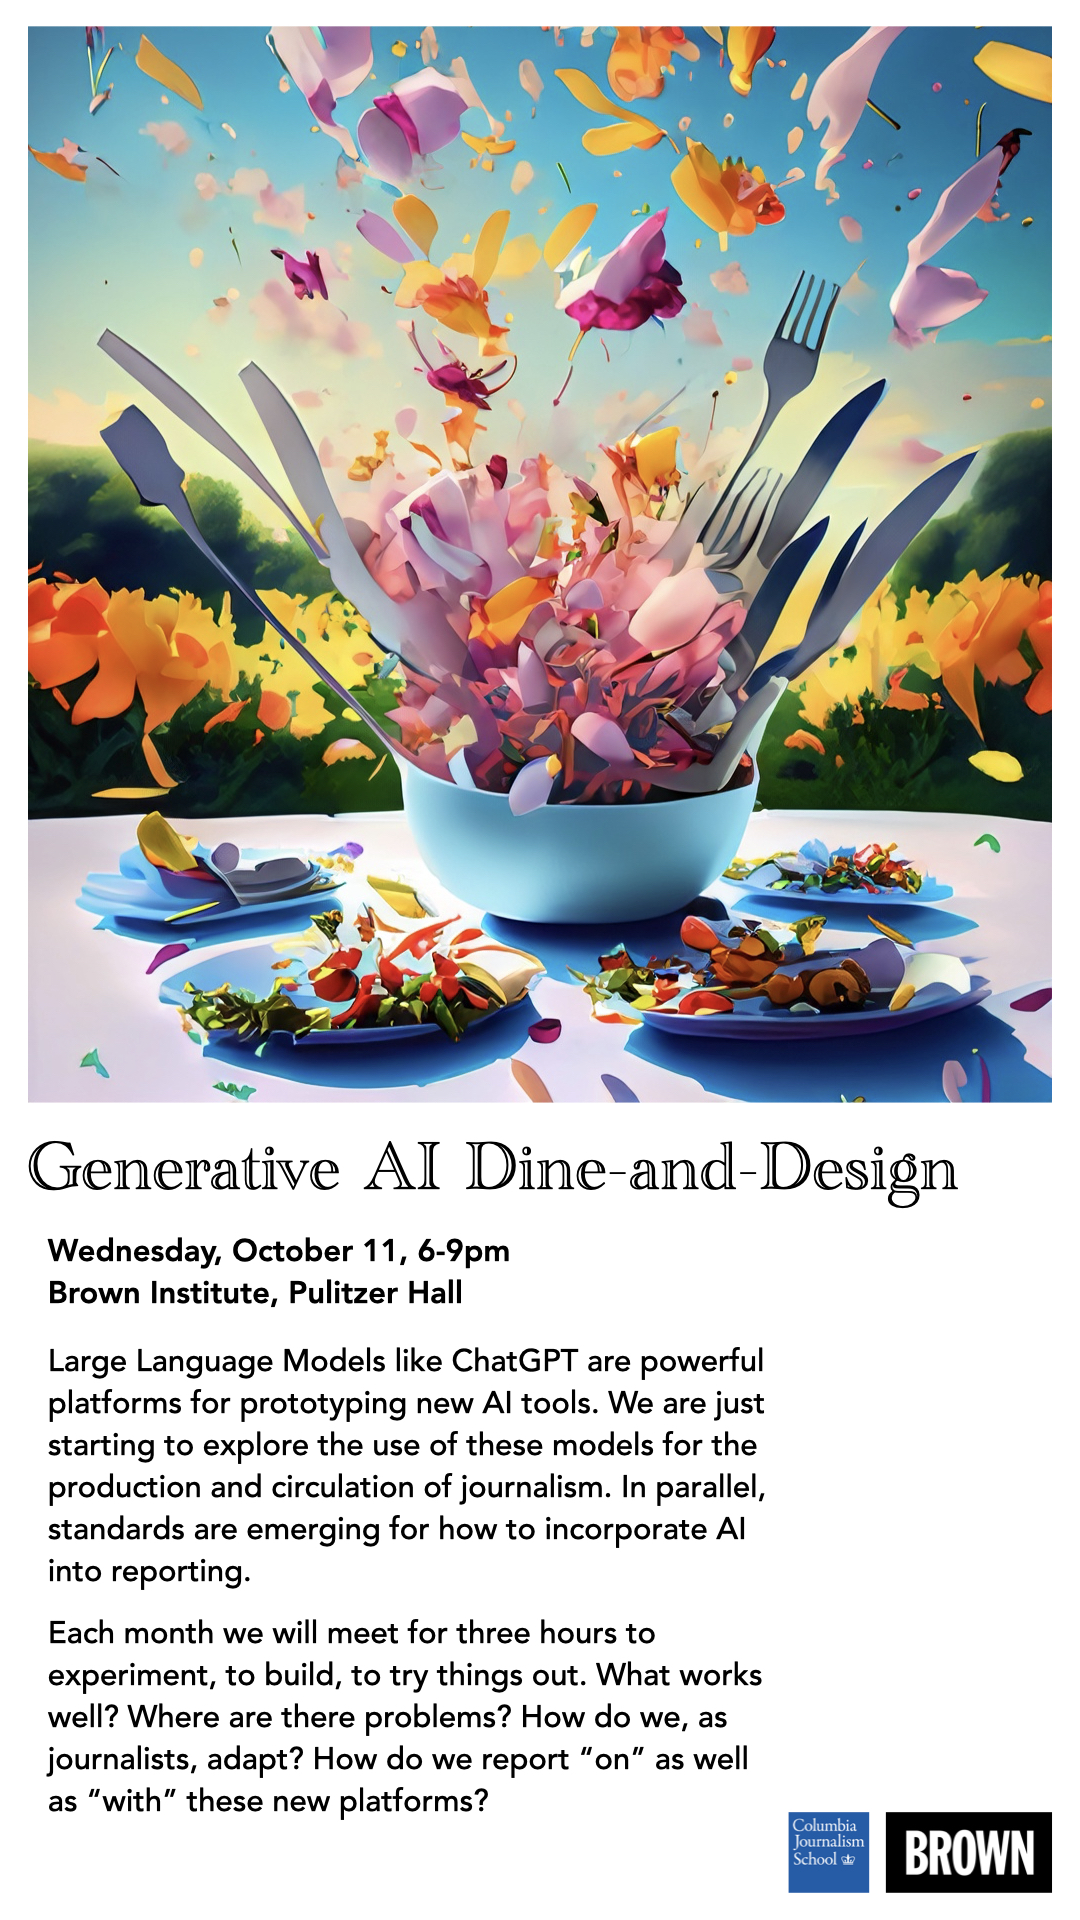
In the last year, new generative AI platforms have made headlines. Large Language Models (LLMs) like ChatGPT, Bard, LLaMA and claude have been compared on their abilities to perform knowledge and reasoning tasks (answering questions, solving problems with external tools), language manipulation (generating summaries, translating text, “reversioning” stories), and common data analyses (structuring data, tagging

Using FOIA

Brown Institute at Columbia 2950 Broadway, New York, NY, United States

A Talk and demo of MuckRock, a website empowering citizens and journalists to write, file and track public records requests online, and its new FOIA Logs tool

Generative AI Dine + Design

Brown Institute at Columbia 2950 Broadway, New York, NY, United States

In the last year, new generative AI platforms have made headlines. Large Language Models (LLMs) like ChatGPT, Bard, LLaMA and claude have been compared on their abilities to perform knowledge and reasoning tasks (answering questions, solving problems with external tools), language manipulation (generating summaries, translating text, “reversioning” stories), and common data analyses (structuring data, tagging

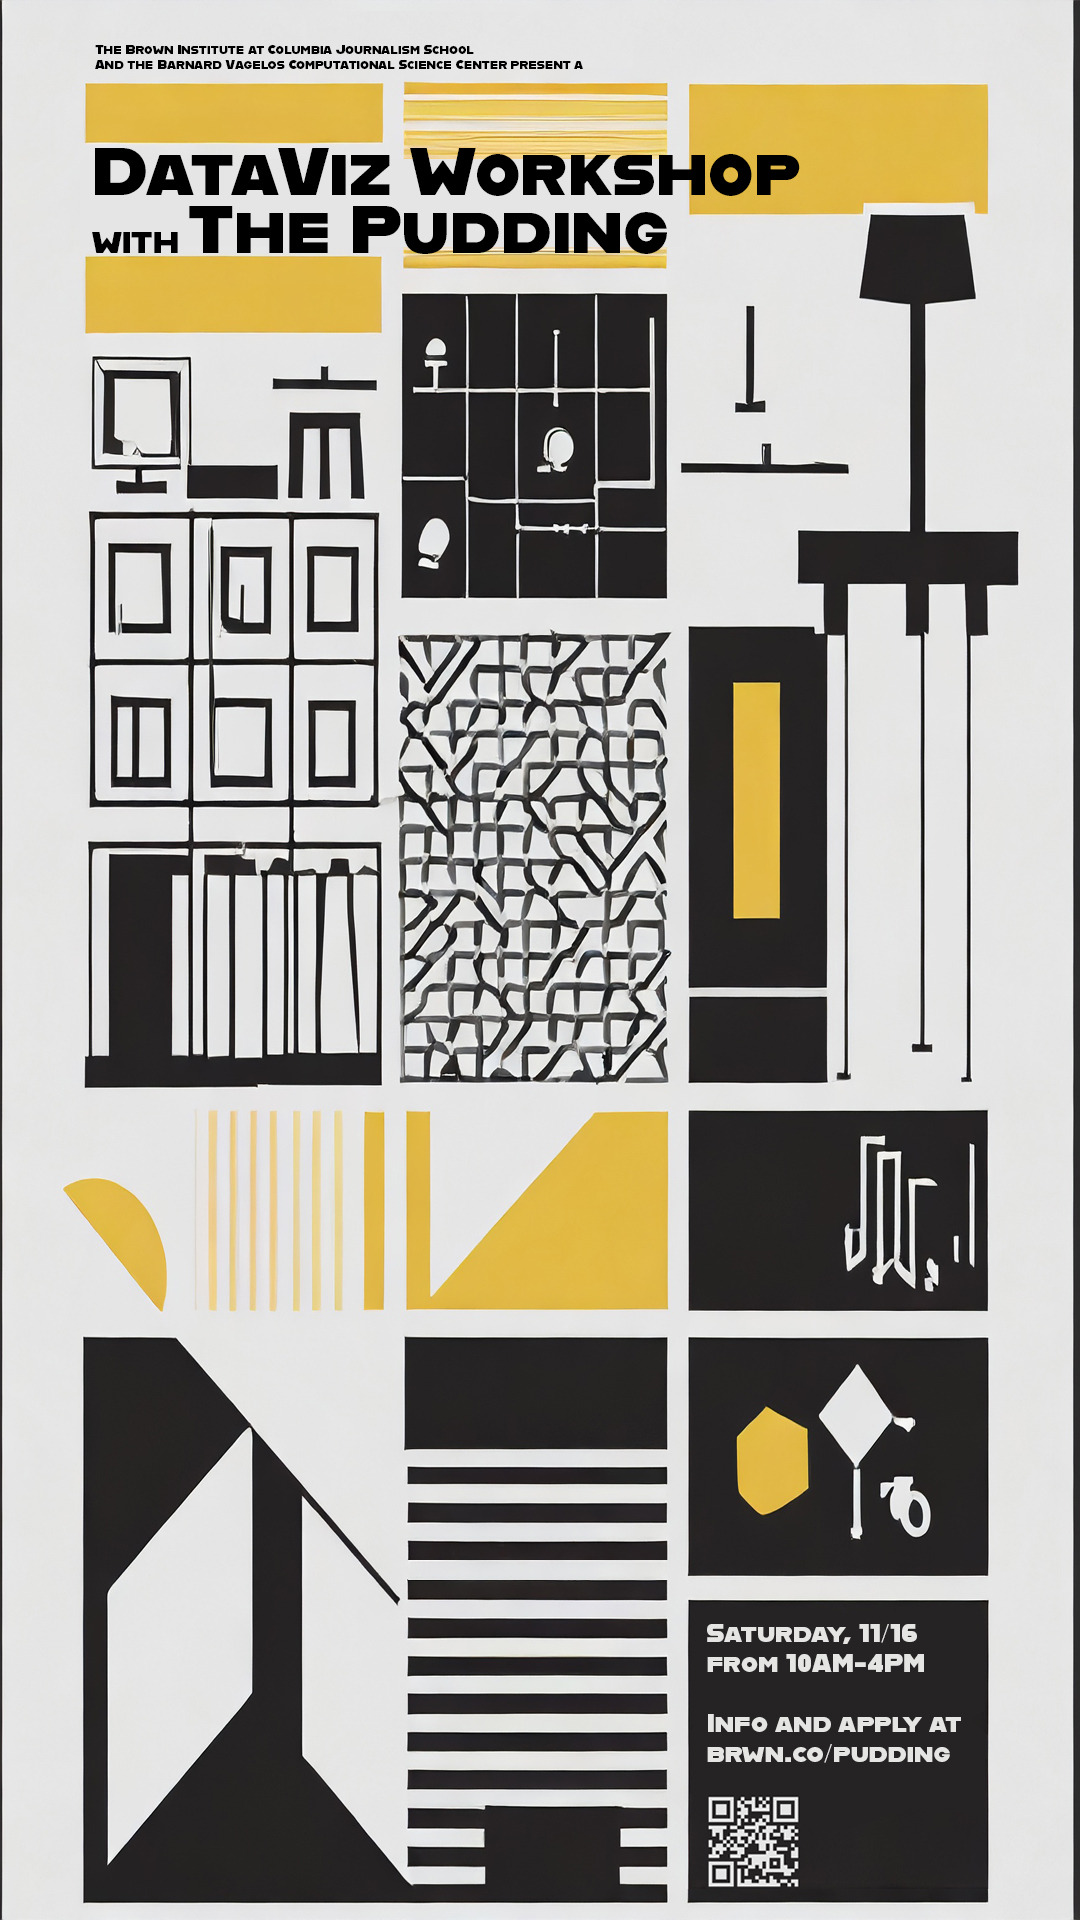
Data Visualization Workshop with The Pudding

Brown Institute at Columbia 2950 Broadway, New York, NY, United States

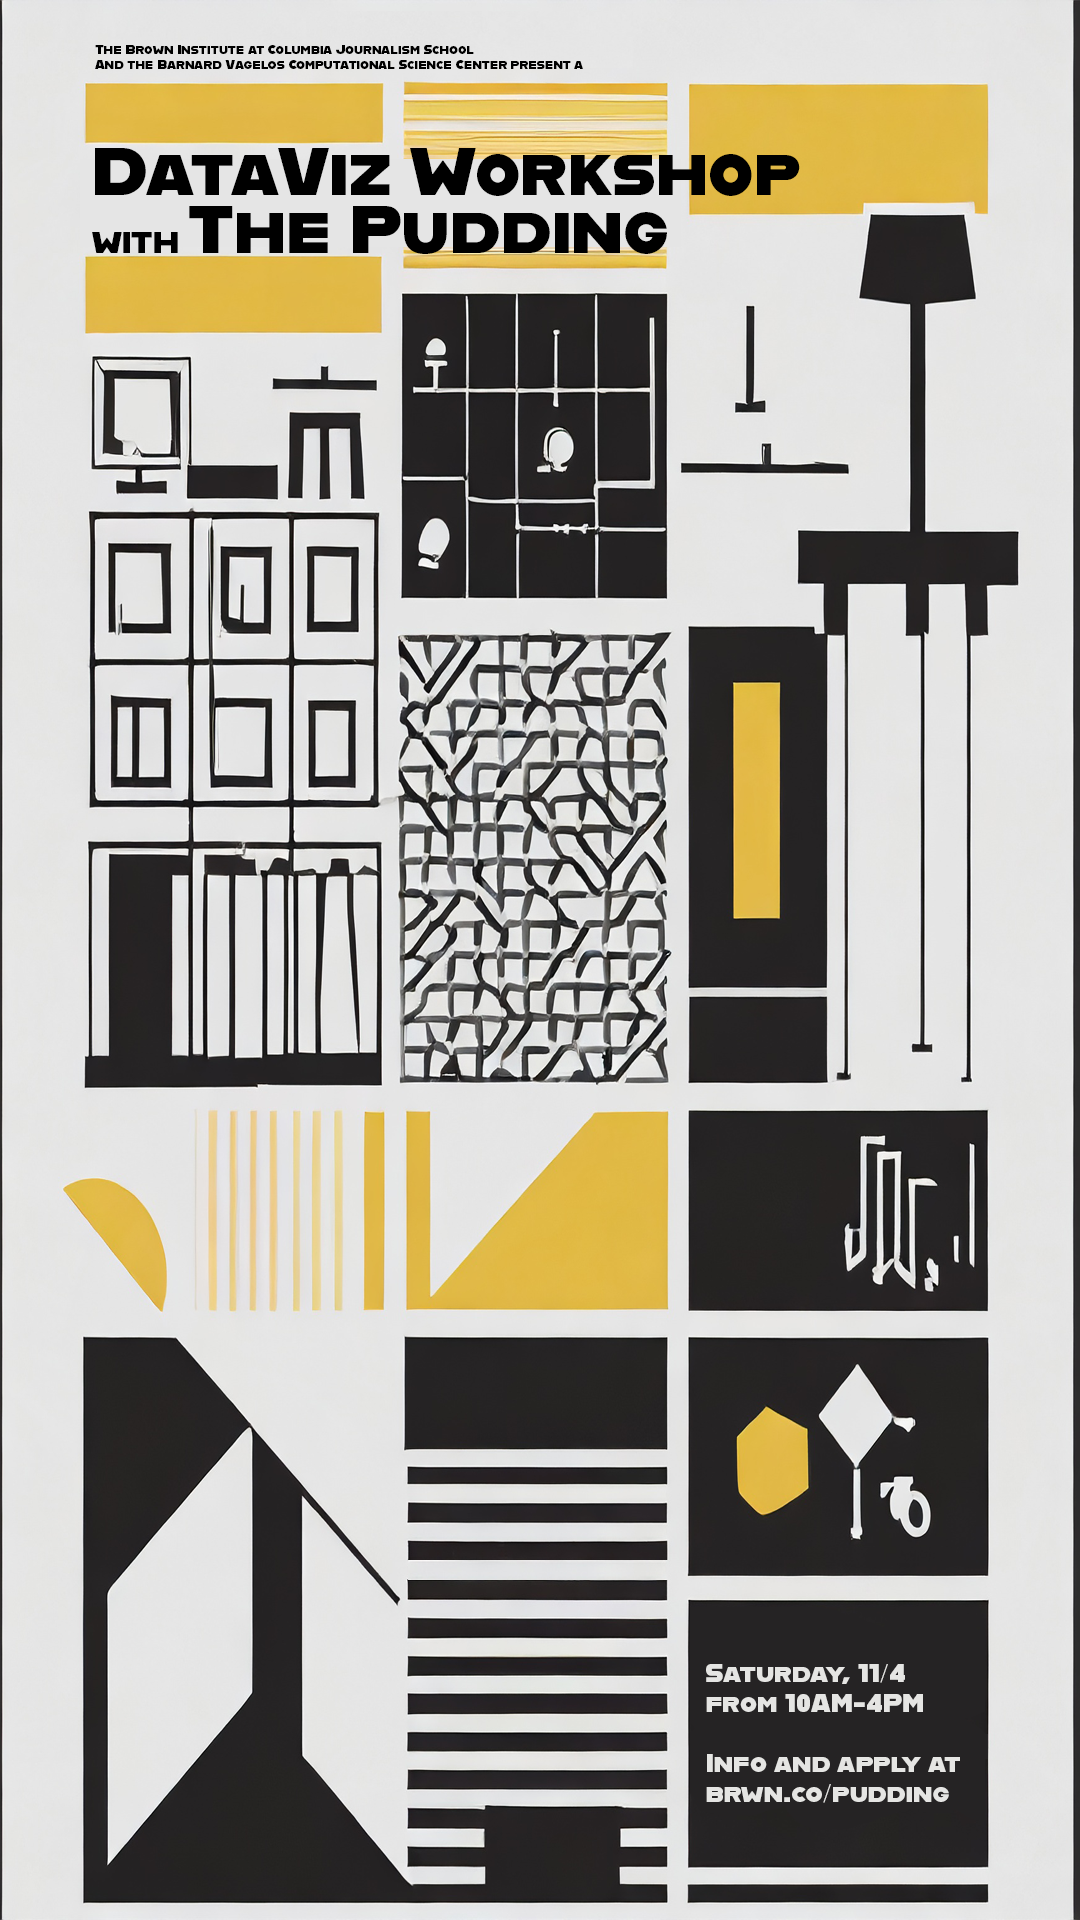
Graphical (or pictorial) presentations of data have become an almost essential part of journalistic practice. Data visualization helps us see patterns in data and is an important tool for finding stories. Over the past decade, major outlets including The New York Times, Washington Post, and Reuters are publishing data visualizations that push the idea of

Generative AI Dine + Design

Brown Institute at Columbia 2950 Broadway, New York, NY, United States

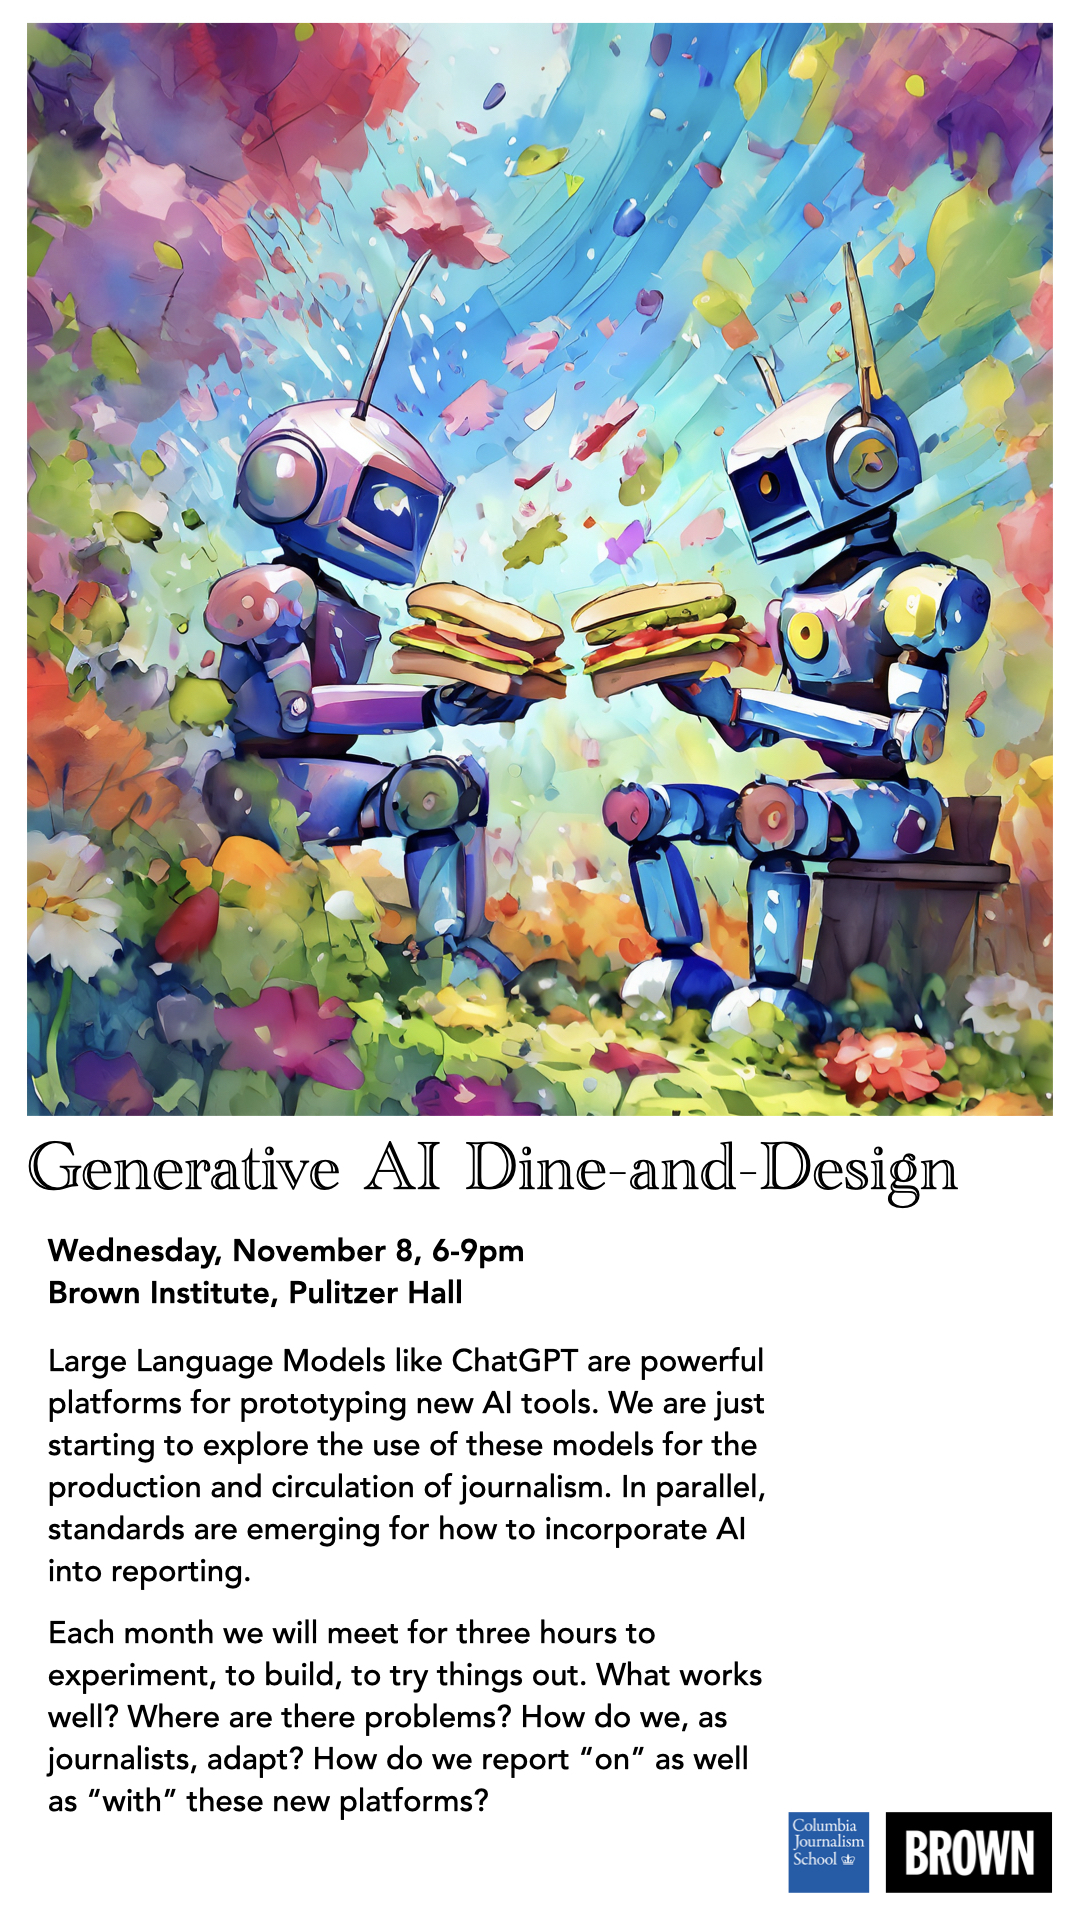
In the last year, new generative AI platforms have made headlines. Large Language Models (LLMs) like ChatGPT, Bard, LLaMA and claude have been compared on their abilities to perform knowledge and reasoning tasks (answering questions, solving problems with external tools), language manipulation (generating summaries, translating text, “reversioning” stories), and common data analyses (structuring data, tagging

News Products and Entrepreneurship Weekend!

Brown Institute at Columbia 2950 Broadway, New York, NY, United States

Register to attend! Join the Brown Institute for a unique opportunity to learn about the latest trends in news product development! Our weekend-long event, taking place November 11 and 12, is led by industry leaders Dalit Shalom, Lead Product Designer at the New York Times, and Justin Hendrix, CEO and Editor of Tech Policy Press.

Generative AI Dine + Design

Brown Institute at Columbia 2950 Broadway, New York, NY, United States

In the last year, new generative AI platforms have made headlines. Large Language Models (LLMs) like ChatGPT, Bard, LLaMA and claude have been compared on their abilities to perform knowledge and reasoning tasks (answering questions, solving problems with external tools), language manipulation (generating summaries, translating text, “reversioning” stories), and common data analyses (structuring data, tagging

Open Source AI Hackathon

Brown Institute at Columbia 2950 Broadway, New York, NY, United States

Catalyzing New Forms of Journalism and Civic Information Join Hacks/Hackers and the Brown Institute for Media Innovation at Columbia University for a weekend of building with open source AI for experiments relating to journalism and civic information, sponsored by Hugging Face and Codingscape. The latest open source, large language models are rapidly becoming as capable

Creative Commons Open Licensing Workshop (Postponed until the Fall!)

Brown Institute at Columbia 2950 Broadway, New York, NY, United States

Curious how open licensing media content can better spread news? Join the Brown Institute for Media Innovation and Creative Commons for a practical workshop on Creative Commons licensing. Creative Commons will provide an initial overview of open licensing, copyright and what it means for media before leading participants through a fun, hands-on practical application of

Data Visualization Workshop with The Pudding

Brown Institute at Columbia 2950 Broadway, New York, NY, United States

Graphical (or pictorial) presentations of data have become an almost essential part of journalistic practice. Data visualization helps us see patterns in data and is an important tool for finding stories. Over the past decade, major outlets including The New York Times, Washington Post, and Reuters have been publishing data visualizations that push the idea