Data is widely considered to be the oil of the information economy – a core commodity that powers insights, innovation, and wealth creation. But unlike oil, data is non-rivalrous and easily transported and shared. However, the current infrastructure built around data processing has adopted a rivalrous approach – building walls, moats, and other obstructions to the sharing of data across society. This approach has built great wealth for the owners of major data processing firms, but failed to unleash data’s potential energy to build a society that exhibits what Edmond Phelps calls mass flourishing. This failure is the focus of the Mapping Data Flows project.
The Mapping Data Flows project has created an interactive multi-layered data visualization of how data flows within one highly complex technology system. Because of its central role in media and social media, the project has focused on the core terms of service for four dominant consumer technology companies in the United States: Amazon, Apple, Facebook, and Google. Research focused on identifying and studying applicable law, firms’ end user licensing agreements (EULAs) and Terms of Service (TOS), as well as primary research with subject matter experts and firm representatives. The initial work product is realized as an architectural “blueprint” of how data flows through these four key companies’ governance architectures.
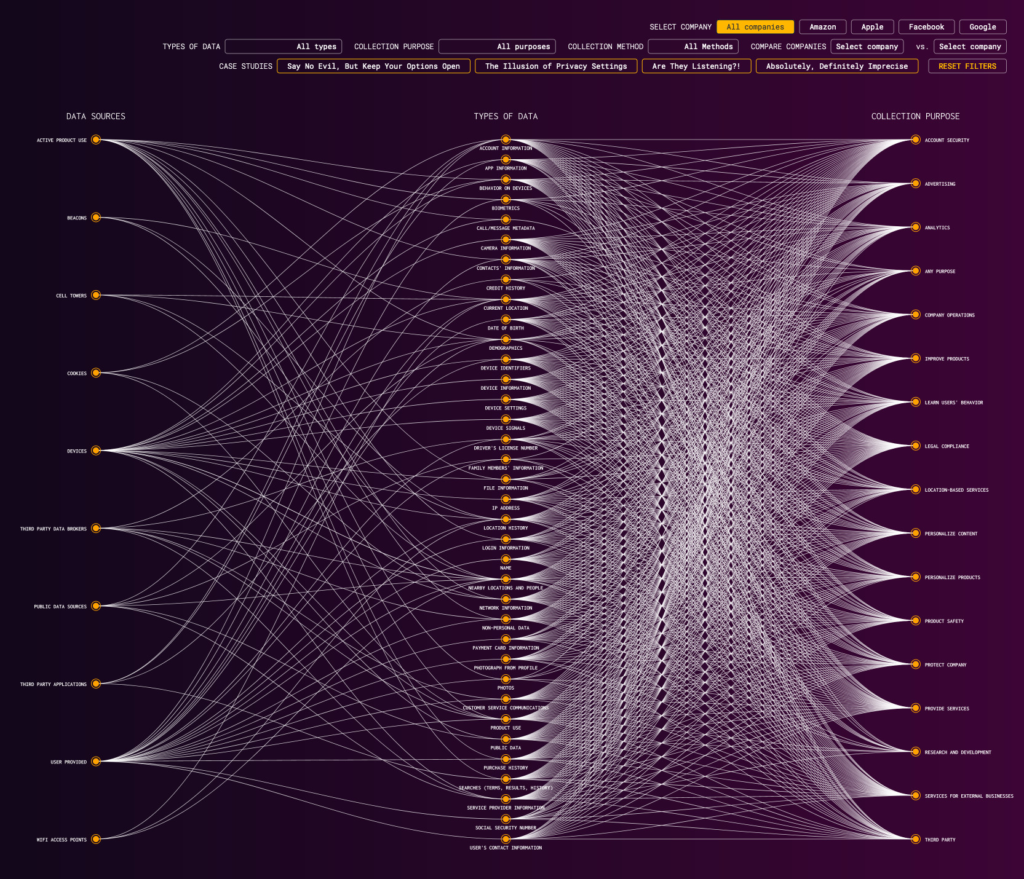
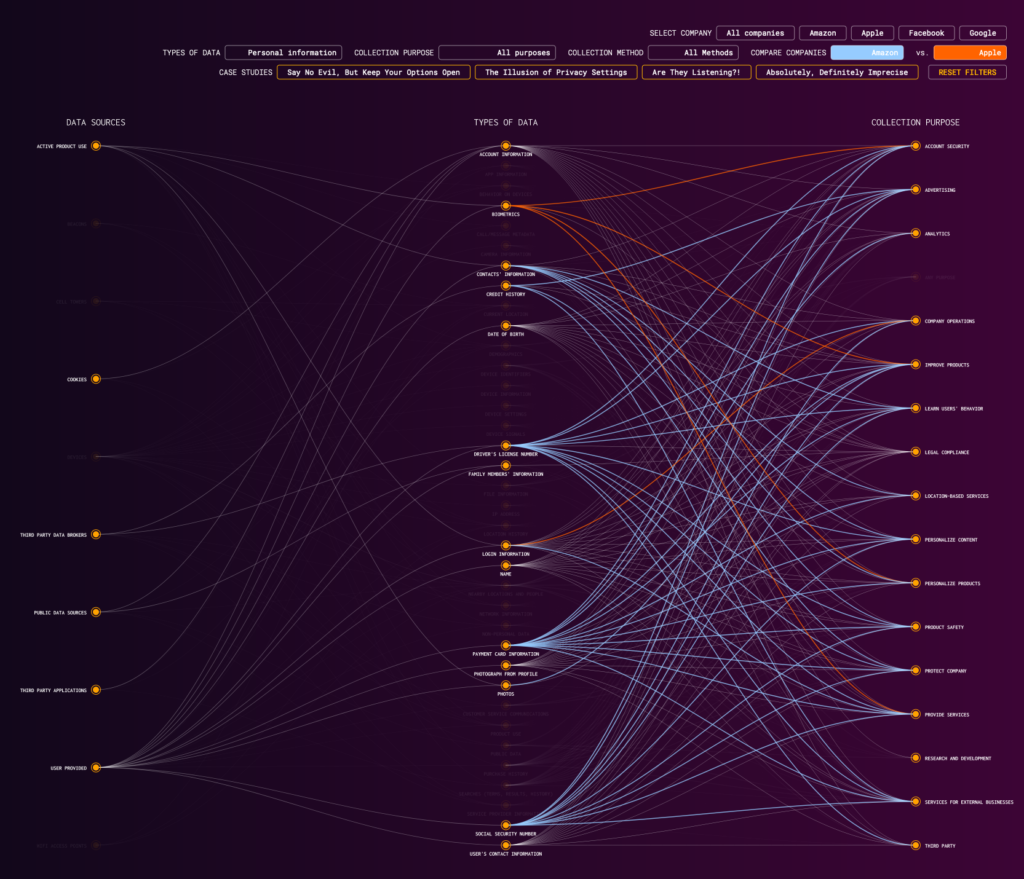
The Mapping Data Flows project converted each term and data type in a core subset of Amazon, Apple, Facebook, and Google’s policies into discrete database entries. This master database powers an online visualization allowing anyone to explore key insights into the four companies’ key policy documents.
For each company’s core policy document(s), the Mapping Data Flows team distilled, categorized, inputted, and tagged each pertinent term, in essence converting a static legal document into data. Our goal was to visualize the privacy policies of tech companies to help users understand where, why and which of their data is collected. These privacy policies are a consumer’s only window into understanding how their data is collected and used. Our theory is that visualization of this information may make it more comprehensible to the average consumer, as well as useful for future researchers. In addition, through visualizing this information we hoped to understand how companies differed from one another in their policies and practices.
In addition to visualizing the terms of service of Amazon, Apple, Google, and Facebook, the Mapping Data Flows project also includes visualizations for some of Google’s historical terms of service and for Zoom, the now popular video conferencing software. Grouping Google’s 2001, 2010, and 2019 terms of service into a single visualization allows us to understand how much these policies have changed over time and highlight possible inflection points in their evolution. As for Zoom, even though its number of users is nowhere near the Big Four’s, it’s dramatic rise in popularity during the COVID-19 pandemic prompted us to apply the same investigative and visualization methods to its terms of service.
We can imagine multiple ongoing initiatives for future iterations of the Mapping Data Flows project. Currently, the data set is static and contained in a simple spreadsheet application. We’d like to map the database to the actual company policies, creating an updated data set that informs a real time visualization. We would also like to expand our data set to a more comprehensive set of policies, both of the Big Four, as well as across other key industries and companies such as agriculture, health care,and energy. We believe we will find similarities in “non-tech” industries as it relates to the private governance of key data commodities.
The Mapping Data Flows team includes:
- John Battelle (Lead), Adjunct Professor and Senior Research Scholar at Columbia SIPA and project lead for Mapping Data Flows. Founder or co-founder of seven technology and media businesses, author of international best seller The Search, investor, board director, and commentator on technology, media, and business.
- Juan Francisco Saldarriaga (Visualization Lead), senior data and design researcher at the Brown Institute for Media Innovation at Columbia University where he also teaches data visualization, data journalism, and user interface design.
- Mark Hansen (advisor), director of the Brown Institute for Media Innovation at the Graduate School of Journalism at Columbia University, focusing on statistical analysis, data journalism, and digital media.
- Zoe Martin, Research Associate and Masters Candidate, SIPA, Columbia University. Martin has extensive experience in quantitative analysis (Los Alamos Lab) and legal analysis (Vigil Law).
- Natasha Bhuta, Research Associate and Masters, SIPA, Columbia University. Bhuta has worked with large corporation and startups on digital product management and strategy.
- Matthew Albasi, Research Associate and MS, Data Journalism, Columbia University. Albasi is a documentary filmmaker, local publisher, a specialist in data journalism, and is currently an Investigative Journalism Fellow at Columbia.
- Veronica Penney, Research Associate and MS, Data Journalism, Columbia University. Penney is currently an Investigative Journalism Fellow at Columbia.
Support for the Mapping Data Flows project was generously provided by SIPA Technology & Policy Initiative, the Brown Institute for Media Innovation, and the Omidyar Network.