The Brown Institute for Media Innovation is pleased to announce the launch of the Stanford Cable TV News Analyzer, an interactive tool that gives the public the ability to not just search transcripts, but also compute the screen time of public figures in nearly 24-7 broadcasts from CNN, Fox News and MSNBC.
Each day, cable TV news networks determine what information millions of Americans receive. They also set the context and tone of the information presented. Editorial decisions, about who appears on cable TV news and what they talk about, shape public opinion and culture. Many newsrooms and monitoring organizations, like Media Matters, American University’s Sunday Morning Monitor Archive, and NPR’s On The Media, routinely audit the content of news broadcasts, but these efforts involve the tedious and time-consuming work of manually counting who and what is on air.
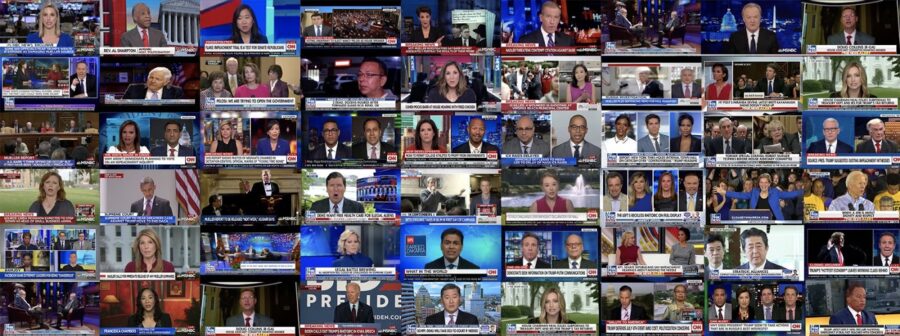
To increase transparency around daily editorial choices, the Stanford Cable TV News Analyzer (tvnews.stanford.edu) uses modern AI techniques to automatically measure who is on the news and what they talk about. The tool leverages computer vision to detect faces, identify public figures, and estimate characteristics such as gender to examine news coverage patterns. To facilitate topic analysis the transcripts are time-aligned with video content and compared across dates, times of day, and programs.
We invite you to examine how the world’s biggest stories are being covered and how your favorite cable news network compares to the competition. Right now you can use the Stanford Cable TV News Analyzer yourself to analyze over 270,000 hours of TV news, counting the screen time of politicians, newsmakers, and experts you might be curious about or analyzing coverage of the 2020 American election campaign.
Analysis and insights from the tool are being gathered at medium.com/tvnewsanalyzer, and we invite you to share any findings or discoveries you make after using the tool to tvnews-project@stanford.edu.
How to Use the Tool
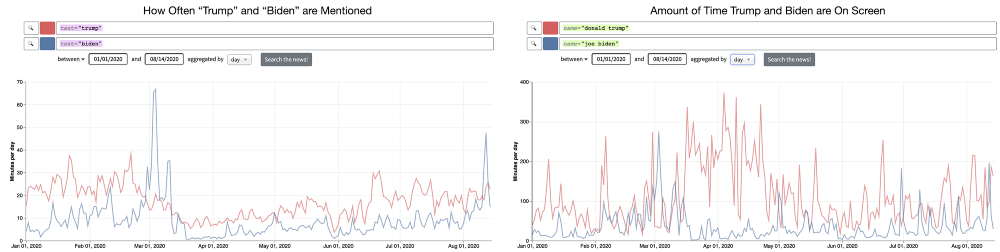
Left: Mentions of “Trump” and “Biden” drop in late March and April 2020 as coronavirus dominated the news (view interactive chart). Right: A comparison of screen time shows that while Biden’s screen time was low during this period, Trump was on screen more than at any other point in 2020 (view interactive chart).
The Stanford TV News Analyzer provides an easy way to measure the representation of people and events on cable news. The site is updated with the latest broadcasts each day and now includes near 24–7 broadcasts of CNN, Fox News, and MSNBC beginning on January 1, 2010 (over 270,000 hours of video). We encourage you to use its transcript search and screen time measurement features to ask your own questions, like:
- Does coverage of political candidates lead or lag the polls?
- On which channels do controversial phrases like “Chinese coronavirus” first appear? (Tucker Carlson was first on January 23rd, but anchors on all three channels used the term in the same week).
- What is the breakdown of screen time by gender on the most popular cable news programs?
We invite you to our Getting Started page and our explainer article to learn more about how to measure the contents of cable news yourself.
More About the Project
Please direct all questions about the Stanford Cable TV News Analyzer to tvnews-project@stanford.edu. For questions about our dataset and our data labeling methodology, please see our methodology page. We also address frequently asked questions, including concerns about the use of automated facial recognition technology.
If you are considering using data from this site for further analysis, we would be happy to assist in validating the data. Please contact us at tvnews-project@stanford.edu.
For more examples of analyses performed using the Stanford Cable TV News Analyzer, as well as more detail on the design of this website and our methodology for video labeling, please see our technical report on arXiv:
Analyzing Who and What Appears in a Decade of US Cable TV News
J. Hong, W. Crichton, H. Zhang, D. Y. Fu, J. Ritchie, J. Barenholtz, B. Hannel, X. Yao, M. Murray, G. Moriba, M. Agrawala, K. Fatahalian (August 2020)
The Team
James Hong (student lead), Jacob Ritchie, Jeremy Barenholtz, Will Crichton, Daniel Fu, Ben Hannel, Xinwei Yao, Haotian Zhang
Maneesh Agrawala, Forest Baskett Professor Computer Science and Director of the Brown Institute for Media Innovation at Stanford University
Kayvon Fatahalian, Assistant Professor of Computer Science, Stanford University
Geraldine Moriba, Journalist, documentary filmmaker, broadcast news executive, and former John S. Knight Journalism fellow
Funding and Partnership Support
The Stanford Cable TV News Analyzer builds on previous Magic Grant projects Esper and Audio-visual Analysis of 10 Years of TV News which focused on building open-source software infrastructure to analyze, visualize and query extremely large video collections, and incorporating data from the Internet Archive’s TV News archive.
The Stanford Cable TV News Analyzer was created by the Computer Graphics Lab at Stanford University in collaboration with the John S. Knight Fellowship Program.
The project is supported by financial and computing gifts from the Brown Institute for Media Innovation, Intel Corporation, Google Cloud, Amazon Web Services, and the National Science Foundation. The video dataset was provided for academic use by The Internet Archive.