News unfolds in places and every newsworthy event is shaped by the details of location. Those details might include the specifics of a neighborhood as it is today or of the history leading to its current configurations. Alongside the development of web technologies, journalistic organizations have incorporated web-based maps to enhance reader engagement with stories. But these interactions haven’t always been easy to produce.
Points Unknown will train journalism students in GIS and mapping techniques, and will prompt them to ask questions such as: What data are made public? What do they say about life in the city? How are neighborhoods rendered in data and what are the consequences of those representations? What undiscovered stories can be found in visualizing geographies of data?
The module will focus on introducing core methods to engaging with / producing both static, annotated, and web-based maps — and will provide an introduction to spatial data. Spatial training paired with journalism can serve as a missing “integrator” of data and the real world—providing lessons that travel beyond the boroughs of New York.
In Spring 2022, the Brown Institute will conduct a set of four workshops focused on introducing mapping as a tool for discovery and expression. These sessions will be conducted using QGIS, an open-source mapping software.
The workshops will take place across 4 sessions from 10AM-12PM on February 15, and 22, and March 1, and 8.
Register for the Spring sessions here. If you have any questions, reach out to Michael Krisch (mkrisch@columbia.edu) or Juan Saldarriaga (jfs2118@columbia.edu). Details about each session can be found below.
Week 1 – Intro to Mapping and Spatial Data
In this session, we will begin with an overview of spatial data and what constitutes a map. Following a presentation on concepts, we will introduce the software we will use throughout the module (QGIS) and begin by making a basic map.
Week 2 – Basic Spatial Analysis and Visualization
In session 2 of Points Unknown, we will move beyond basic maps to begin working with various types of spatial data, including data from the Census. We will make a variety of visualizations from this data, and perform basic spatial analysis.
Week 3 – Advanced Spatial Analysis
In advanced spatial analysis, we will move beyond operations such as overlays and spatial joins and begin to perform analysis on our data. This will include common operations, such as generating heatmaps, and more complex operations such as generating isochrones.
Week 4 – Annotated 3D Maps
To conclude our series, we will switch gears and utilize Google Earth Pro and Adobe Illustrator to export high resolution 3D earth imagery and add annotation layers to it. This is a very common technique for visualizing movement and space, and we will walk students through the process from start to finish.
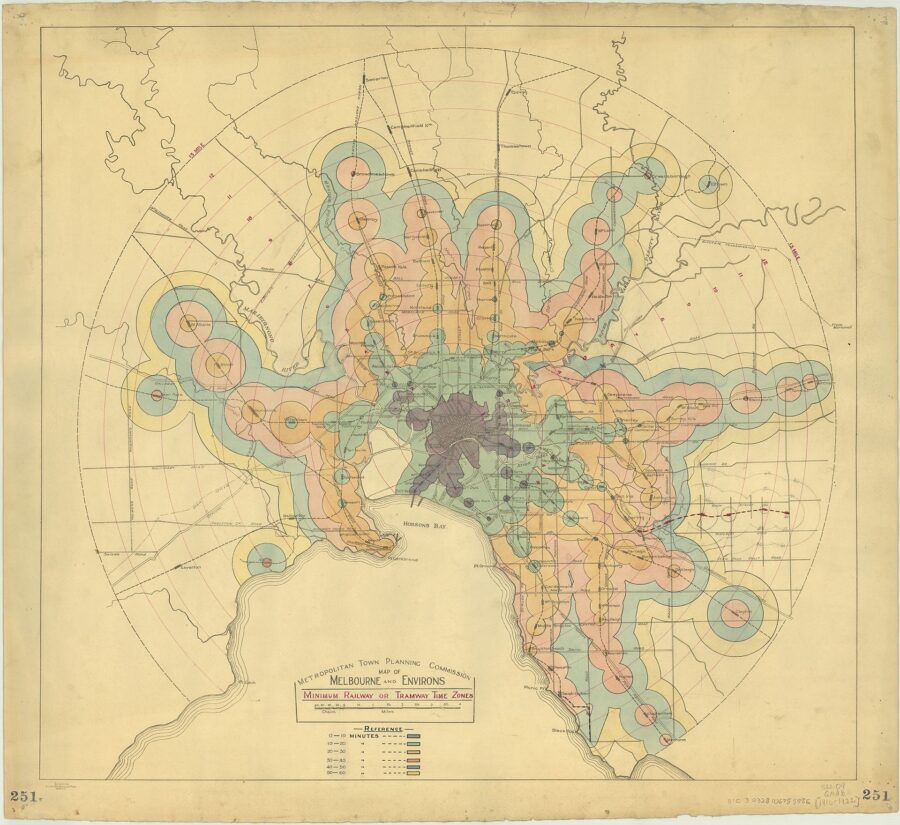
Image: An early isochrone map of Melbourne rail transport travel times, 1910-1922 (hosted by the State Library of Victoria)