This weekend the Brown Institute at Columbia sponsored two events. In the Brown Institute space on the ground floor of Pulitzer Hall, Ellen Weinstein led a day-long workshop on illustration and journalism. One flight up, in the Lecture Hall, students from the School of Journalism and the Department of Statistics joined forces in a hackathon mixing data and story.
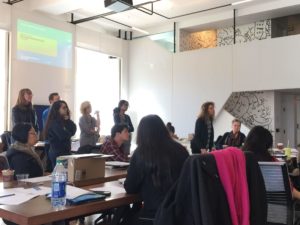
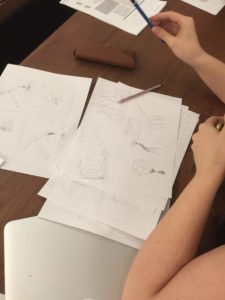
As part of the Transparency Series, the session downstairs introduced J-school students to an aspect of publication that is usually not discussed in the curriculum. As Ellen put it, an illustration is like the book cover for your story. Students started with rapid sketches in response to verbal prompts like “identity” or “social security” or “bullying.” Then, an exercise for pairs of students, one playing art director and the other an illustrator.
Downstairs, the day finished with each participant being asked to start an illustration for a story they had written or were thinking about. This was a very special session of the Transparency Series in that it stripped the subject matter to something very basic — pencil and paper. Thinking through the relationship between illustration and story proved to be an invaluable exercise for our students and we’re grateful for Ellen’s encoragement and support.
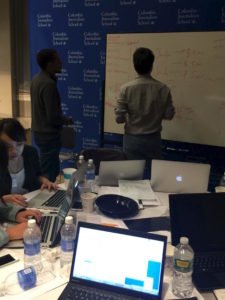
Upstairs at the hackathon, students started their day learning about the data that had been prepared for them to work on. Members of the Newscorps data science team took them through FEC filings, presidential speeches and the Centers for Medicare & Medicaid Services payment data. Soon after that, teams formed, mixing journalists and statisticians. We kept the group small — about 30 people in all — for this event. From the J-School we invited members of our Dual Degree with Computer Science as well as our Data Concentrators, and the statistics students were all members of the newly-formed Statistics Club. The combination of journalism and statistics created unique projets. To be frank, this is the first hackathon I’ve attended that emphasized both the quality of the story being told, as well as the tools used to tell it. Data visualizations mixed with digital platforms to craft a unique collection of stories.
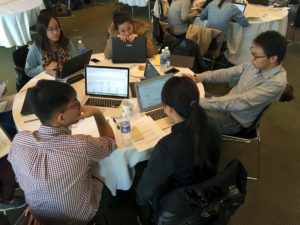
Work upstairs continued until around 9pm Saturday night and picked up again at 8am Sunday morning. Judging will take place at 4pm after a talk by Ben Wellington. Stay tuned for the results!
